|
ZIVELAB has provided electrochemical instruments design and developemt in hardware and software.,
|

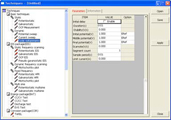
ZIVE SM, Smart Manager Version6 is to control ZIVE SP/MP/PP/BP models. It provides user defined test sequence using sequence file,technique menu and batch file which serial test using sequence files and/or technique files.
This software is easy to use and functions which support various electrochemical experiments including functions of system control, schedule file editor, real time graph, analysis graph, user calibration, data file treatment etc.
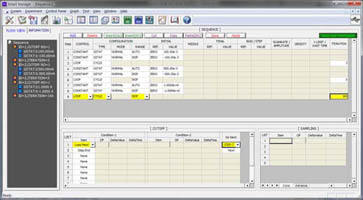
 Sequence editor Sequence editor
|
Control Parameters
|
|
Constant
|
GSTAT: Constant Current
|
|
Crate: Constant Crate
|
|
PSTAT: Constant Potential
|
|
POWER: Constnat Power
|
|
LOAD: Constant Load
|
|
CC-CV: Constant Current-Constant Voltage
|
|
Crate-CV: Crate-Constant Voltage
|
|
CP-CV: Constant Power-Constant voltage
|
|
CL-CV: Constant Load-Constant voltage
|
|
Id: Current denisty
|
|
Is: Specific current
|
|
OCP: Open circuit potential
|
|
STEP
|
GSTAT: Staircase Current waveform
|
|
PSTAT: Staircase Potential waveform
|
|
SWEEP
|
GSTAT: Linear Current Sweep
|
|
PSTAT: Linear Potential Sweep
|
|
FAST-G: Fast linear Current Sweep
|
|
FAST-P: Fast Linear Potential Sweep
|
|
EIS
|
GSTAT: Galvanostatic EIS
|
|
PSTAT: Potentiostatic EIS
|
|
OCP: Eoc bias PEIS
|
|
PSUEDO: Psuedo Galvanostatic EIS
|
|
HFR G: Galvanostatic HFR
|
|
HFR P: Potentiostatic HFR
|
|
MsineG: Multisine GEIS
|
|
MsineP: Multisine PEIS
|
|
FRA
|
GSTAT: GEIS for external potentiostat/electronic load
|
|
PSTAT: PEIS for external potentiostat/electronic load
|
|
HFR G: Galvanostatic HFR for external potentiostat/electronic load
|
|
HFR P: Potentiostatic HFR for external potentiostat/electronic load
|
|
REST
|
|
|
ZRA
|
|
|
Pulse
|
Vpulse: Potential Pulse waveform
|
|
Ipulse: Current Pulse waveform
|
|
|
GSINE: Galvanostatic Sine waveform
|
|
|
PSINE: Potentiostatic Sine waveform
|
Cut-off(Vertex) condition
- Time(step, test, loop, cycle)
- Current, current density
- Voltage
- Capacity
-.. -dV
- |dV/dt|
- |dI/dt|
- |dT/dt|
- Temperature
- Aux1,2,3
- Eoc
- WHr
- Power
- Crate
- Percent Capacity (LCC,LCD,FCC,FCD)
etc.
Sampling condition
time, |dI/dt|, |dV/dt|, |dT/dt|, |dA1/dt|, burst time
Batch function
Basic techniques
1) Potentiostatic
2) Galvanostatic
3) OCP measurement
4) Double Step Potentiostatic
5) Double Step Galvanostatic
6) Potential sweep
7) Current sweep
8) Cyclic voltammetry
9) Fast Potential Sweep
10) Potentiostatic Ru measurement
11) Galvanostatic Ru Measurement
|
 |
EIS techniques
1) Potentiostatic EIS
2) Galvanostatic EIS
3) Pseudo galvanostatic EIS
4) OCP(*1) EIS
5) Frequency scanning potentiodynamic EIS
6) Fixed frequency potentiodynamic HFR
7) Frequency scanning galvanodynamic EIS
8) Fixed frequency galvanodynamic HFR
9) Galvanostatic HFR monitor
10) Potentiostatic HFR monitor
11) Potentiostatic Multisine EIS
12) Galvanostatic Multisine EIS
13) Intermettent PEIS
14) Intermittent GEIS
*1. The system measures open circuit potential before for each frequency change and apply AC sine wave on this potential.
Electrochemical analysis techniques
- Step techniques
- CA(Chronoamperometry)
- CC(Chronocoulometry)
- CP(Chronopotentiometry)
- Sweep techniques
- LSV(Linear sweep voltammetry)
- SDV(Sampled DC voltammetry)
- Fast Linear Sweep voltammetry
- Fast Cyclic Voltammetry
- Pulsed techniques
- DPV(Differential pulse voltammetry)
- SWV(Square wave voltammetry)
- DPA(Diff. pulse amperometry)
- NPV(Normal pulsed voltammetry)
- RNPV(Reverse normal pulse voltammetry)
- DNPV(Differential normal pulse voltammetry)
Corrosion techniques
- Tafel(Tafel experiment)
- Rp(Polarization resistance)
- Ecorr vs. Time
- PDYN(Potentiodynamic)
- CYPOL(Cyclic polarization resistance)
- GDYN(Galvanodynamic)
- Reactivation
- RpEc trend
- Galvanic corrosion
- IR compensation for each techniques
Energy(Battery ) techniques
- CC/CV test for lithium battery charging/discharging cycle life test
- CC/CC test for NiCd or NiMH etc. battery charging/discharging cycle life test
- Discharging test
- EVS(Electrochemical voltage spectroscopy)
- Variable scan rate CV
- Potentiostatic IV curve
- Galvanostatic IV curve
- Steady State CV
- GITT
- PITT
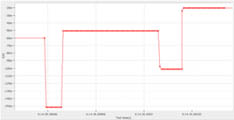 |
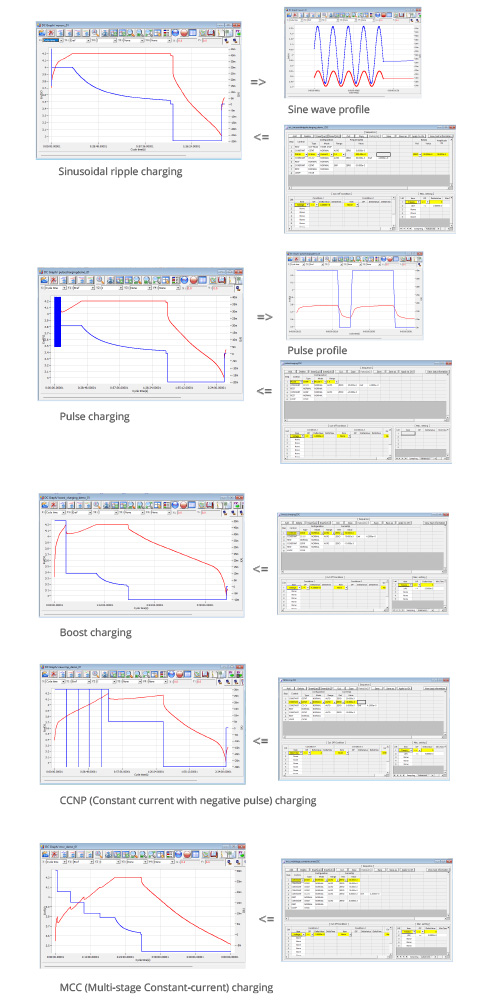
Pulse mode is available for GSM & CDMA profile. Pulse shape profile can be measured by user’s demand. Pulse shape profile monitor (micro seconds order).
|
4-2) Control mode
1) Charge: CC, CC-CV, Ipulse, Vpulse, Isine, Vsine
2) Discharge: CC, CC-CV,CP, CR, Ipulse, Vpulse, Isine, Vsine
4-3) Cutoff condition;
Time, voltage, current, power, temperature, AuxV etc.
Various battery charge/discharge test is available including pulse discharge for GSM, CDMA application.
Control & real time graph
|
Smart Manager program provides 2kinds of virtual control panel for control & data acquisition with real time graph. One is for single channel control and the other is multichannel control. User can control and monitor in this control panel and he/she can monitor
|
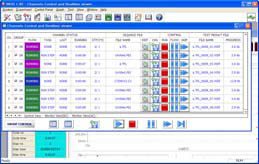
Multichannel Control Panel
|
|
Multichannel real time graph
|
data in VOI(value of interest) window and channel status in one window. Real time graph’s X Y axis format will be changed per techniques automatically. It can be defined by user's demand per techniques. For experiment using sequence file or batch file, user can select 3 real time graph's X, Y axis parameter.
|
|
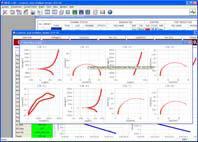
Single channel control panel
|
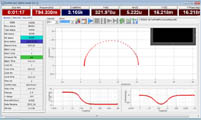
Each real time graphs format also can be selected. Real time graph format and VOI will be changed depending on DC test or impedance test automatically. Virtual control panel can display graph for recent test result by setting. For impedance measurement, wave
|
form monitor will be displayed on real time graph to check wave quality. This monitor can be switched to Lissajous (I vs. E) plot. Graph.
Smart Manager's graph function is to simplify the operation. There are 3 kinds of graph per experiments. You can change X, Y1, Y2, Y3, Y4 axis parameter as you want. Each graph provides short buttons. When you click these buttons, graph format will be changed following short button format.
Strip Chart Recorder :
DC graph for general data display
Short button for I vs. V, E vs. LogI, V, I vs. time are provided.
Graph parameters: Time, Eref, I, Eoc, Id, Aux1, Aux2, Aux3, Temp, LogI, Load, ChQ, DchQ, ChQs, DchQs, Ch P, Dch P, Ch-Wh, Dch-Wh, Sum Wh, Sum Q, Sum |Q|, |Q|, Rp, Ch Q/Q0, dQ/dV, Q-Q0
EIS graph for EIS data display
Short button for Nyquist plot and Bode plot are provided.
Graph parameters: Frequency, Zre, -Zim, Zmag, Zph, Y’, Yimg, Y , |Y|, Yph, LogZ, LogY, Rs(R-C), Cs(R-C), Rp(R|C), Cp(R|C), Rs(R-L), Ls(R-L), Q(R-L), time, Vdc, Idc, Temp, Aux(1,2,3)
BAT graph for battery cycle data display
Short button for cycle capacity and cycle average plot are provided.
Graph parameters: cycle number, Ch Q, Dch Q, Sum Q, Coulomb Eff, Ch-Wh, Dch-Wh, Sum Wh, Energy Eff, MinV, MaxV, ChQs, DchQ, ChVavg, DchVavg, Vavg
|
Impedance(ESR) measurement for QC/QA
Suitable for impedance measurement at fixed
frequency using independent software.
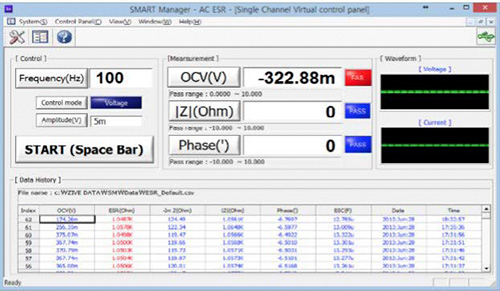
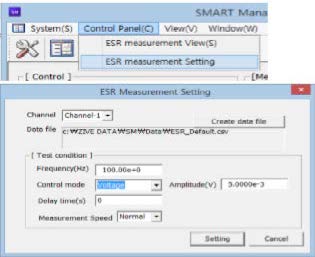
You can do the above function by replacing file name. It provides simple
results with text data files showing “pass” “fail” decision.
The measurement operation is simply click the “start” button or press
space bar.
|
|