|
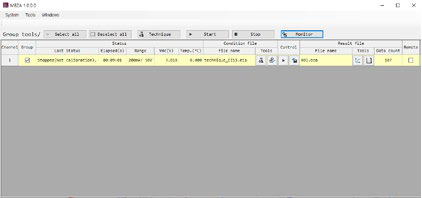
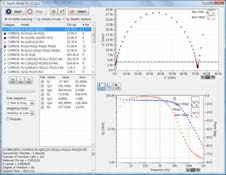
Control Screen
- Mutichannel operation under mixing
configuration with different model is available
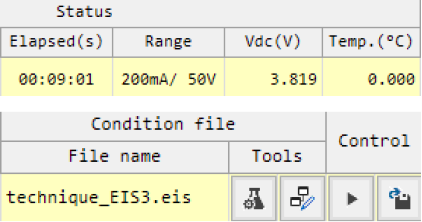
- Real-time monitoring of current/voltage range, measured voltage value,
and measured temperature value regardless of a test is started.
(data are not logged.)
- Displaying schedule file and data file name - Schedule file selection/modification - Start/Stop operation
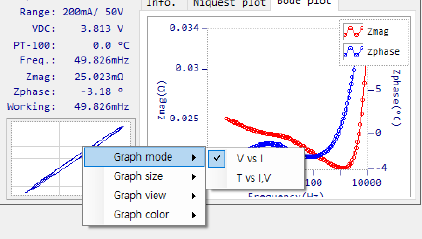
Real time plot and data monitoring
- Lissajous plot/ current, voltage vs. time for AC waveform
- Galvanostatic EIS (Quick galvanostatic EIS)
Nyquist plot / Bode Plot
- Rs-psuedo Rp/ HFR both
Cs, Cp vs time graph
- Zre, Vdc vs time graph (HFR)
- Rs-psuedo Rp vs time graph (Rs-psuedo Rp measurement)
- Vdc, Temperature vs time graph (Vdc_Temp monitor)
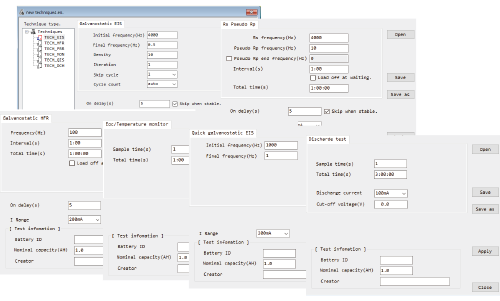
Technique selection & Parameter Input Box
- Galvanostatic Electrochemical Impedance Spectroscopy
Bias & amplitude value is determined by current range setting
Parameters: Frequency range, data density, iteration
- Rs-psuedo Rp measurement
Rs frequency, psuedo Rp frequency setting
Interval & Total time setting
- High frequency resistance measurement(HFR)
HFR frequency setting
Interval & Total time setting
- Voltage - Temperature monitor (Rest monitor or Discharge monitor)
- Quick galvanostatic EIS for screening
(samples)
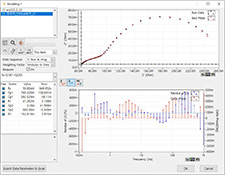 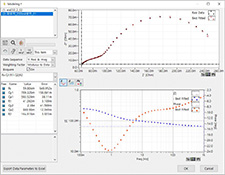
Fitting display LEVM fitting
Automatic Model Searching
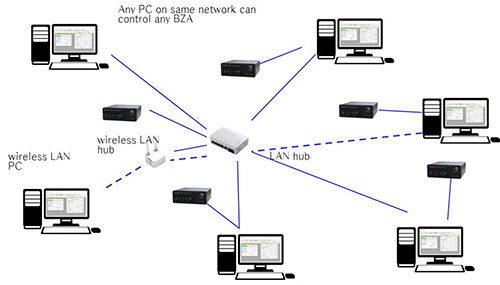
Network configuration(Wired,Wireless)
|